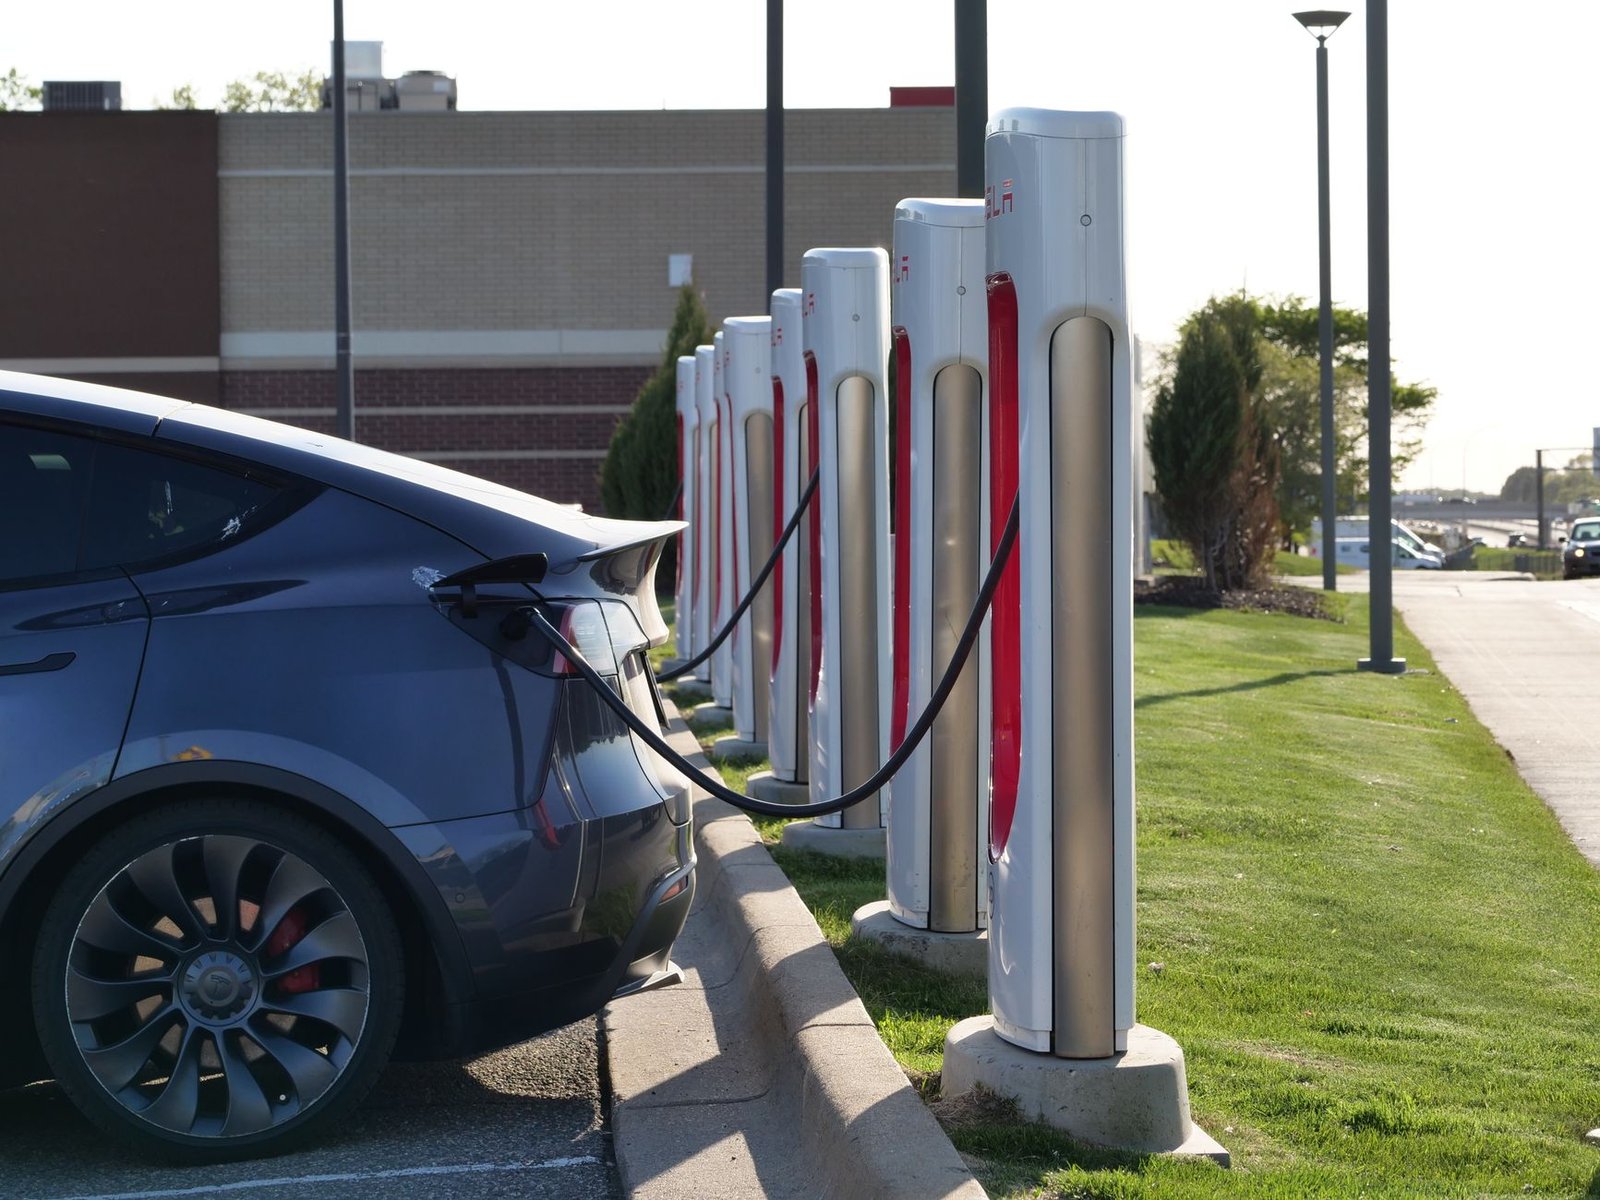
A Shanghai-built 2022 Tesla Model 3 with an LFP battery pack sat at 77,726 miles when its new owner ran the official battery health test. The result: 92% capacity retention. That single number, extracted from Tesla’s onboard diagnostics after a full discharge-charge cycle, carries less certainty than it appears to promise.
The test drew 62.4 kilowatt-hours from the charger. Subtract standard charging losses of roughly 10% and you get about 56 kWh actually stored in the cells. But against what baseline? Tesla doesn’t publish exact pack capacity for the rear-wheel-drive Model 3. Industry estimates peg gross capacity at roughly 60.5 kWh when new, with 57 to 57.5 kWh usable after reserves. That makes the 92% figure either conservative or accurate, depending on which denominator you choose and whether early-life capacity fade already occurred before this owner took delivery.
Measuring What You Can’t See
Battery testing confronts an attribution problem. Capacity loss compounds from multiple mechanisms operating simultaneously: solid-electrolyte interphase growth at the anode, lithium plating during fast charging, particle cracking in the cathode, electrolyte decomposition. These processes interact. A cell cycled daily between 20% and 80% state of charge degrades differently than one routinely charged to 100%, even at identical mileage. Temperature history matters. Charge rate matters. Time at high voltage matters.
The 78,000-mile Model 3 arrived with unknown charging habits. Its previous owner might have DC fast-charged three times weekly or plugged into a Level 2 charger nightly at 50% state of charge. The pack might have spent summers in Phoenix or winters in Minnesota. These variables leave permanent signatures in capacity fade, but the test captures only the final state.
Tesla’s built-in diagnostic offers convenience at the cost of precision. It requires the vehicle to discharge through normal use, then complete a full charge cycle while monitoring energy flow. “Full” depends on starting conditions the test doesn’t independently verify. Thermal management during charging consumes energy that gets counted in the 62.4 kWh total but never enters the battery cells. Conversion losses vary with ambient temperature, charge rate, and battery temperature. Energy metered at the charge port versus energy actually stored in cells can range from 8% to 12% depending on conditions.
The LFP Endurance Question
Lithium iron phosphate chemistry trades energy density for cycle life. LFP cathodes are more tolerant of repeated cycling than nickel-rich chemistries, and they handle 100% state of charge without the accelerated degradation seen in nickel-cobalt cells, which is why Tesla recommends charging LFP packs to 100% regularly for accurate range calibration. The trade: substantially less energy per kilogram than nickel-cobalt-aluminum cells, which matters for range but not for degradation rate.
Swedish retailer Carla analyzed LFP-equipped Model 3s at 62,000 miles and found 93.3% average capacity retention, per their fleet data. That result sits 1.3 percentage points above the 92% figure from this 78,000-mile example, a difference that could reflect measurement variance, usage patterns, or actual degradation. Sample size matters. One vehicle at higher mileage doesn’t establish a trend. Ten vehicles at similar mileage would. A hundred would start to map the degradation distribution.
LFP degradation follows a different curve than nickel-rich cells. Capacity typically drops several percent in the first year regardless of usage as the solid-electrolyte interphase stabilizes, then flattens. A four-year-old pack at 92% retention implies only modest additional fade after that initial formation period. Extrapolating linearly would suggest continued gradual decline toward the low 80s at 200,000 miles, but battery chemistry doesn’t support constant degradation rates. Fade tends to accelerate as lithium inventory depletes and internal resistance rises.
What Buyers Actually Need
Used EV shoppers face an information asymmetry that doesn’t exist in the internal combustion market. A compression test reveals cylinder health. An oil analysis catches bearing wear. Transmission fluid color indicates service history. These diagnostics are inexpensive and return objective data about specific failure modes. Tesla battery health testing returns a single percentage with no breakdown of which degradation mechanism dominates or how much margin remains before performance drops noticeably.
The 92% figure tells you the pack stores roughly 8% less energy than when new, assuming you trust the baseline estimate. It doesn’t tell you whether degradation will continue at the same rate, accelerate, or plateau. It doesn’t separate calendar aging from cycle aging. It doesn’t predict how the pack will perform at 150,000 miles, which is when the calculation actually matters for resale value and total cost of ownership.
Buyers need degradation rate, not just current capacity. A pack at 92% after 78,000 miles accumulated over four years averages 2% fade per year. The same 92% reached in two years would average 4% fade per year. That second vehicle hits 80% retention around year six; the first wouldn’t reach 80% until much later, if the rate held. Time and usage intensity tell the rest of the story that current capacity only begins.
The Missing Infrastructure
Independent battery diagnostics don’t exist at scale because the data remains proprietary. Tesla encrypts battery management system communications. Third-party scan tools can’t reliably access cell-level voltage, temperature, or internal resistance data. This blocks the secondary market from developing the same diagnostic infrastructure that supports used combustion vehicles.
A technician can measure cranking voltage, load-test a 12V battery, and scope alternator ripple in fifteen minutes with modest equipment. Reading individual cell voltages in an EV pack requires manufacturer-specific software, security authentication, and access to battery management system protocols that automakers don’t publish. The technical capability exists but remains locked behind software permissions.
This creates pricing inefficiency. Buyers discount used EVs more than degradation justifies because they can’t verify battery health independently. A 92% capacity result from the manufacturer’s own tool could mean excellent condition or could mean the test methodology flatters actual performance. Without third-party validation, the market applies a risk premium that depresses resale values below what the actual hardware condition supports.
What the 92% Number Actually Means
The tested Model 3 will drive roughly 8% fewer miles per charge than when new. For a vehicle rated at 272 miles of EPA range, that’s about 22 miles of lost range. In practice, drivers charge based on time and convenience, not remaining range. Losing 22 miles from a 272-mile buffer rarely constrains daily use patterns. The pack still supports the same charge rate, the same power delivery, the same thermal management capability.
Degradation becomes operationally relevant when it forces behavior change. An EV that could skip charging overnight twice weekly but now requires nightly charging has crossed a threshold. A vehicle that could road-trip without mid-route charging but now requires a stop has crossed another threshold. The 92% result sits comfortably above both thresholds for typical use cases. It becomes problematic only if degradation accelerates, which the single-point measurement can’t predict.
The four-year, 78,000-mile data point adds one more observation to a degradation curve still being mapped in real time. LFP packs in Model 3s haven’t existed long enough to establish 200,000-mile degradation distributions. The chemistry promises longer cycle life than nickel-rich alternatives, but promises require validation through accumulated fleet data. Each tested vehicle adds information. Each data point narrows the uncertainty band. The 92% result fits expectations for LFP at this mileage but doesn’t yet prove the long-term, high-mileage durability claims that underpin favorable EV total cost of ownership calculations.
Battery health testing needs standardization the way fuel economy testing forced comparable metrics across manufacturers. A single number from a proprietary diagnostic tool can’t support a functioning secondary market. Buyers need degradation trajectories, not snapshots. They need cell-level data, not pack-level averages. They need independent verification, not manufacturer self-reporting. Until that infrastructure develops, battery health percentages will continue to raise more questions than they answer.