Electric cars are just some fad that cost loads more to buy than gasoline cars, so we’d never see an EV sell more than any other American gasoline car in 2018… right? EV range couldn’t be improving by 15-25% each and every year… right? Electric cars couldn’t match (or beat) the price of gasoline cars in just 2-5 years… right? Worldwide sales of electric cars couldn’t have doubled in the last 2 years… right?
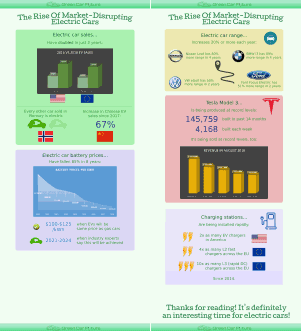
…let’s find out! We did a bunch of research and gathered a tonne of stats, and then summarised the key findings in an infographic. Click on the thumbnail image below to see the full size infographic, or read on for a section-by-section breakdown of the infographic. We also publish all the stats and sources at the end of this post.
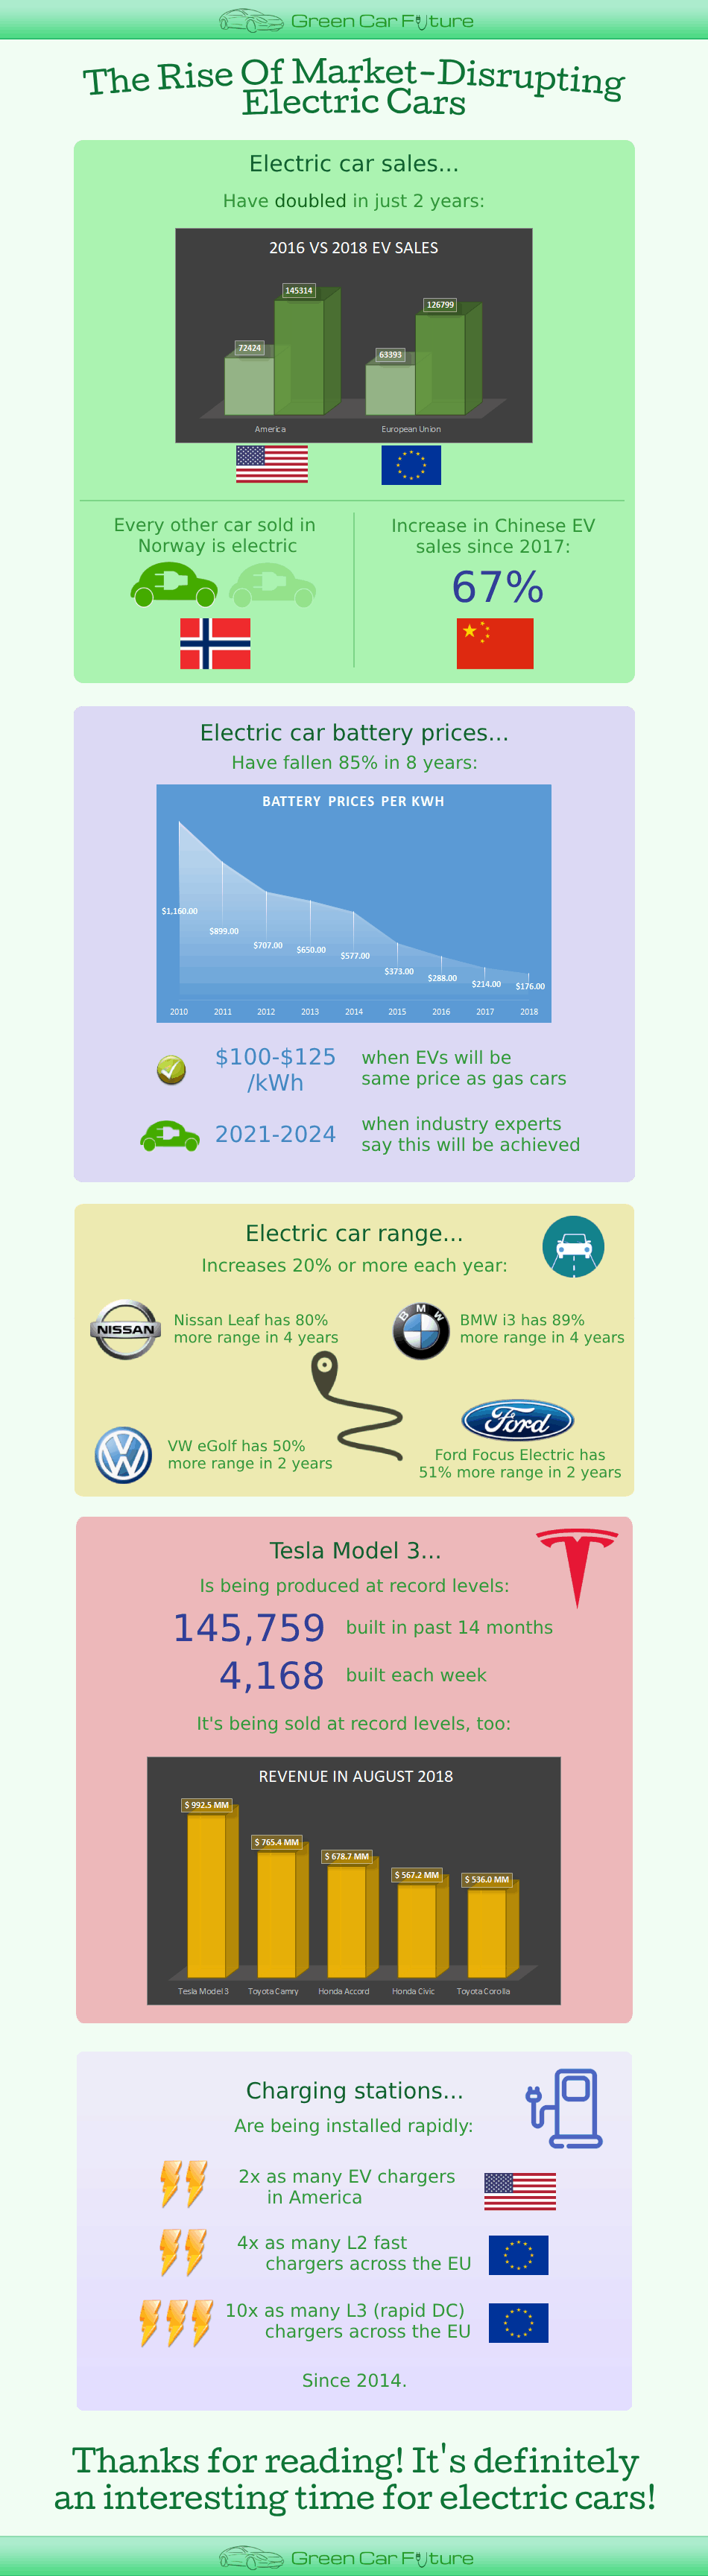
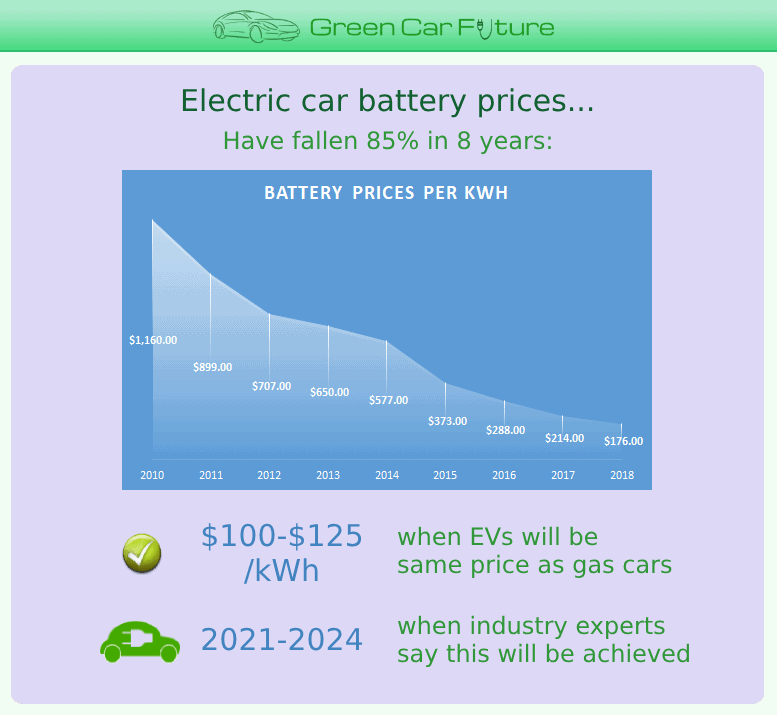
Electric car sales
So EV sales have had a good time in the past few years! Indeed, back in 2012, just 12,820 pure electric cars were sold in America – rising to an estimated 145,314 in 2018. Europe has seen a similar rise in sales too, from 13,529 in 2012 to 126,799 estimated in 2018. (We say estimated because only the first 8-10 month’s of 2018 sales data is currently available, so some data is extrapolated out).
A doubling of EV sales in the past two years (in America and the EU) is also great to see, whilst China looks like it might exceed this with their massive 67% rise in sales in 2018 (compared to 2017)! Plus Norway’s love with green cars shows no sign of slowing down, with every other car sold there being electric – and it looks like diesel cars might practically disappear from their sales within a couple of years (leaving mainly green car sales with ever-decreasing gasoline car sales).
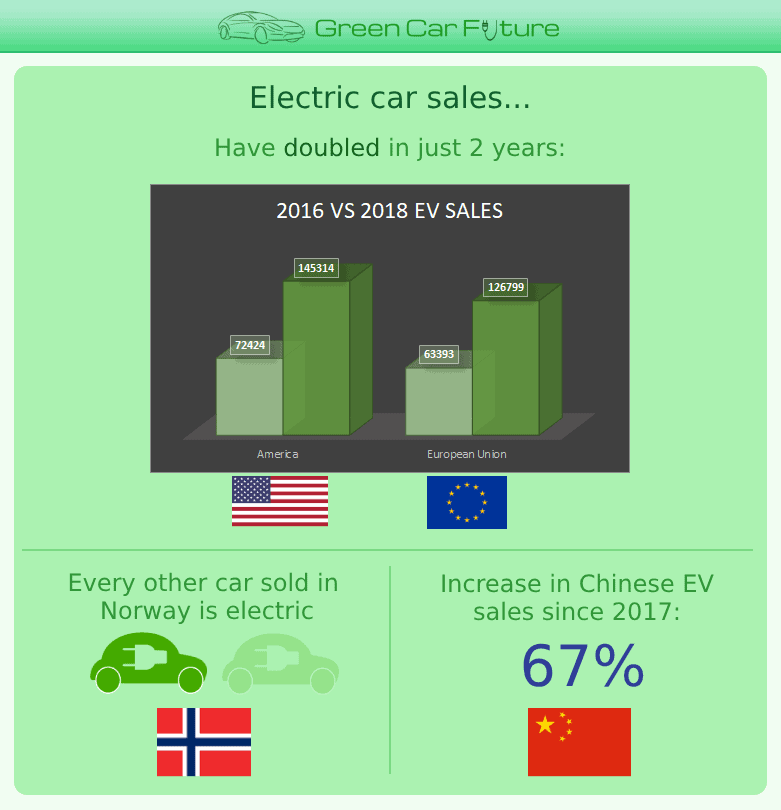
Lithium-ion car battery prices
Lithium-ion battery prices are currently the main reason EVs are expensive, so we – and many other green car websites – are watching the prices intently!
It’s therefore great that they have fallen by 85% in 8 years, and are due to hit $100-125/kWh within 2-5 years. This price point is key because it’ll mean that electric cars can be sold for the same price (or cheaper than!) gasoline cars. The transformation we’ve seen with EV sales will ramp-up even further at this point, because there’d be no financial reason to buy a gasoline car (i.e. since gasoline cars would be more expensive to purchase and have much higher running costs).
The most reliable source for this prediction is Bloomberg NEF, who forecast that this magic rate will be achieved by 2024. However Tesla and certain Chinese battery manufacturers are thought to be aiming for 2021 to hit this price. The idea that EVs could be cheaper than conventional cars in just 2 years is definitely an exciting one!
EV range
Seeing the range of electric cars increase over the years has been good, because ‘range anxiety’ was a genuine factor against EV adoption, and we can’t blame people. A 2015 EV which struggles to get 80 miles (129 km) in real-World conditions is very limiting: a journey to the nearest city and back can be around that distance.
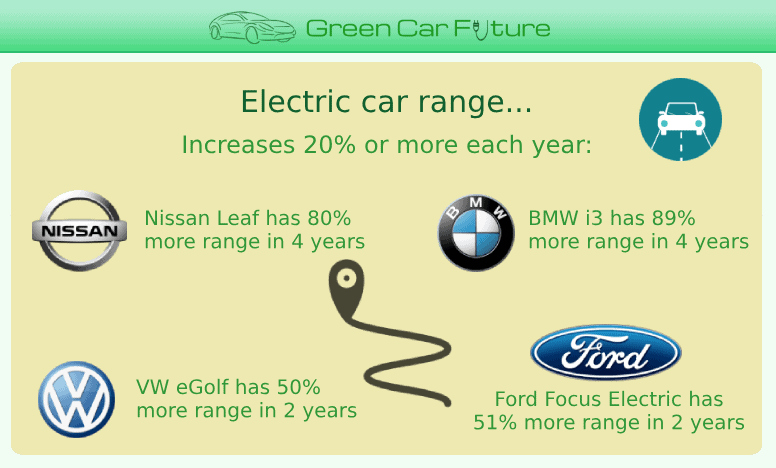
So seeing popular cars like the Leaf go from 84 miles of range (2015) to 151 miles (2019) – an 80% increase in 4 years – whilst essentially keeping the price the same in inflation-adjusted terms is very promising. Plus the Hyundai Kona Electric will have the option of a long range pack, yielding 279 miles (449 km) of range – enough to practically eliminate range anxiety once and for all.
The other 3 cars we looked at (the BMW i3, VW eGolf and Ford Focus Electric) have all increased their range by 20-25% per year, whilst keeping the real price around the same (or lower in the case of the VW eGolf).
The price per mile that these cars offer (aka the purchase price divided by the mile range) has fallen from $345-$535/mile in 2015 to $204-$300/mile today.
As we’ve seen above, a fall in Li-on battery prices has allowed manufacturers to increase range whilst keeping the car price roughly the same. But with range anxiety almost being eliminated due to 200-300+ mile ranges being available, we expect the continuing battery price falls to mainly feed into lower car sales prices instead.
Tesla Model 3
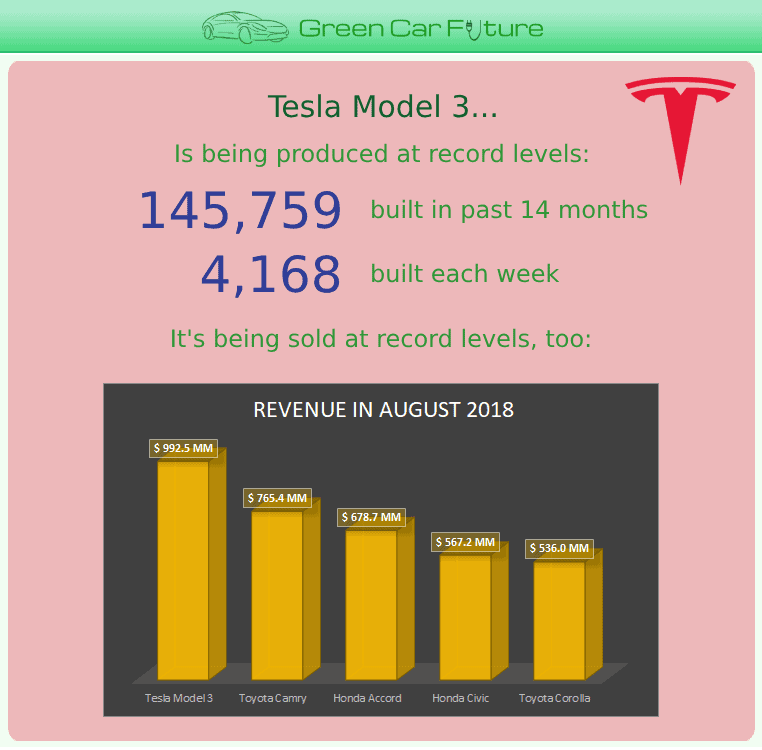
To say that Tesla’s Model 3 is disruptive would be understating it! The Model 3 bought in more revenue than any other car in August 2018, which is remarkable considering that electric cars haven’t become a mass-market product yet (in terms of the public’s mind: most people wouldn’t consider buying one, and would default to a gasoline car for their next purchase).
The Model 3 is also selling 2-3x more than the Nissan Leaf in some markets, despite being more expensive. Previously the Model 3 had been sold in select markets such as America, Canada and China, but it’s now been rolled out throughout the world.
Now that production has ramped up to over 4,000 a week (hence over 200,000 per year), it’s possible that the Model 3 could become the best selling electric car ever by the end up 2020 – a mantle held by the cheaper Nissan Leaf since 2010. In other words, the Model 3 could become the best seller in 3 years, compared to the Leaf’s 10 year production cycle.
Charging stations
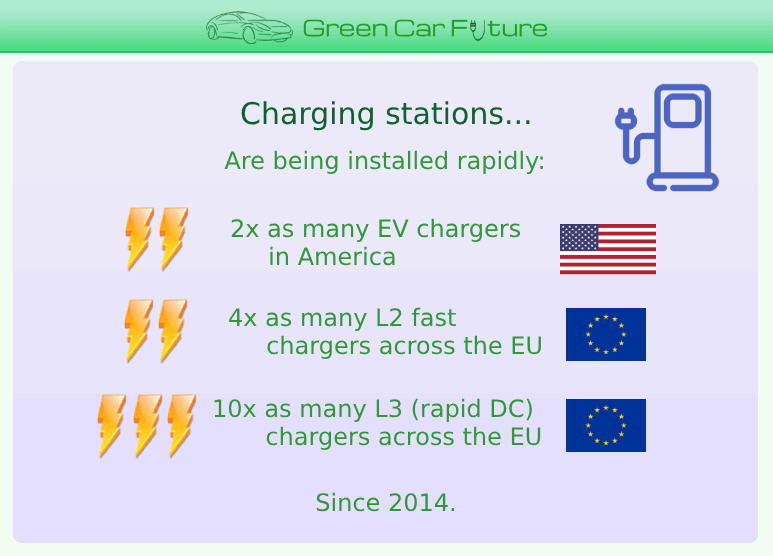
Charging stations have been installed at growing rates in recent years, as you might expect due to growing levels of EV sales! There were 26,077 charging points throughout America in 2014 – rising to 57,129 right now. America also has almost double the number of L3 (rapid DC) charging points in the past 6 months, rising from 5,267 to 9,203. This seems a very high jump, but both figures are from the same underlying data source – it could well be an expansion of Tesla’s Supercharger network (et al) leading to this rise in rapid DC stations.
Europe has seen an even better growth rate of charging stations, up from 24,916 L1/L2 and 2,349 L3 stations in 2014 to an extrapolated 166,335 L1/L2 and 22,681 L3 stations at present.
Whilst American charging points don’t seem to have kept up with the more-than-double level of EV sales since 2014, European charging point numbers have exceeded their own EV sales growth rate.
References
When researching for this infographic, we look at more data and sources than we ended up using. We feel this was important to do, to ensure that we reach the fairest conclusions. Hence the data seen below will be more than just what’s required for the infographic and write-ups seen above.
Electric car sales
American car sales data is from the Alliance of Automobile Manufacturers:
| Car Type | 2011 | 2012 | 2013 | 2014 | 2015 | 2016 | 2017 | 2018 (Extrapolated) | 2018 (until August 2018) |
|---|---|---|---|---|---|---|---|---|---|
| FCEV | 19 | 30 | 19 | 49 | 75 | 1030 | 1862 | 1551 | 1034 |
| BEV | 9178 | 12820 | 46832 | 60368 | 64175 | 72424 | 95610 | 145314 | 96876 |
| PHEV | 7041 | 37711 | 41376 | 56548 | 49118 | 73146 | 92375 | 118273.5 | 78849 |
| HEV | 254971 | 389328 | 536383 | 441988 | 365767 | 336143 | 365320 | 397869 | 265246 |
| Total | 271209 | 439889 | 624610 | 558953 | 479135 | 482743 | 555167 | 663007.5 | 442005 |
European Union car sales data is from the European Alternative Fuels Observatory:
| Year | BEV | PHEV |
|---|---|---|
| 2008 | 73 | 0 |
| 2009 | 295 | 2 |
| 2010 | 892 | 2 |
| 2011 | 9087 | 336 |
| 2012 | 13529 | 9014 |
| 2013 | 23783 | 25844 |
| 2014 | 37110 | 32910 |
| 2015 | 58134 | 89555 |
| 2016 | 63393 | 94108 |
| 2017 | 96347 | 121067 |
| 2018 (Extrapolated) | 126799.2 | 149269.2 |
| 2018 (until October 2018) | 105666 | 124391 |
Chinese sales data was 600,174 sales in 2017 and an extrapolated/predicted 1,000,000 sales in 2018, from the EV Sales blog (which uses data from the EV Volumes data centre) – hence a 67% increase in electric car sales.
Finally, Norway seeing every other sold car being electric is from three sources:
- EV Sales
- Norsk ElbilForening [Norwegian website]
- European Alternative Fuels Observatory [with Norway selected in the country filter]
Lithium-ion car battery prices
The main battery cost data comes from Bloomberg NEF, who recently summed up 2018 Lithium-ion battery prices on a Facebook post giving the data in real terms as:
| Year | $/kWh | ||
|---|---|---|---|
| 2010 | 1160 | ||
| 2011 | 899 | ||
| 2012 | 707 | ||
| 2013 | 650 | ||
| 2014 | 577 | ||
| 2015 | 373 | ||
| 2016 | 288 | ||
| 2017 | 214 | 81.6% | decrease since 2010 |
| 2018 | 176 | 84.8% | decrease since 2010 |
| 2024 | 100 | 91.4% | decrease since 2010 |
This is similar to the nominal-priced Lion battery price data from the Union of Concerned Scientists:
| Year | $/kWh | ||
|---|---|---|---|
| 2010 | 1000 | ||
| 2012 | 750 | ||
| 2014 | 400 | ||
| 2017 | 200 | 80% | decrease since 2010 |
The forecast that battery prices will reach the all-important $100/kWh price is from a few sources:
- InsideEVs [saying Tesla predict battery pack prices might hit $100/kWh by 2021]
- Stanford Energy’s YouTube video [saying Chinese battery manufacturers might hit $100/kWh by 2020]
- Bloomberg NEF [saying $100/kWh will be hit by 2024, a year earlier than the predicted previously]
EV range
The EV range stats come from America’s EPA (for the range in miles and MSRP price), along with other public domain data for the battery capacity. Our prediction that range increased at least 20% a year is based on the below, although it’s worth mentioning that EVAdoption’s research say it’s actually 17%.
| Nissan Leaf Model/Year | EPA Range (Miles) | Battery Capacity (kWh) | MSRP Price (USD) | $/mile | $/kWh |
|---|---|---|---|---|---|
| 2015 S | 84 | 24 | 29010 | 345.3571429 | 1,208.75 |
| 2019 S | 151 | 40 | 30,885 | 204.5364238 | 772.125 |
| change | 79.8% | 66.7% | 6.5% |
We naturally calculated the last 2 columns, along with the final ‘change’ count.
We can also use the BLS inflation calculator to see that $29,010 in mid-2015 is now worth around $30,638.97 – so the Leaf’s price has almost stayed the same (in real terms) whilst range has risen 80%.
Data from other car manufacturers include:
| BMW i3 Model/Year | EPA Range (Miles) | Battery Capacity (kWh) | MSRP Price (USD) | $/mile | $/kWh |
|---|---|---|---|---|---|
| 2015 | 81 | 22 | $43,350 | $535 | $1,970 |
| 2019 | 153 | 42 | $46,000 | $300.6535948 | $1,095.238095 |
| change | 88.88% | 90.91% | 6.1% |
With $43,350 in 2015 being worth around $45,775.29 today.
| VW eGolf Model/Year | EPA Range (Miles) | Battery Capacity (kWh) | MSRP Price (USD) | $/mile | $/kWh |
|---|---|---|---|---|---|
| 2015 | 83 | 24 | $33,450 | $403 | $1,394 |
| 2017 | 125 | 36 | $30,495 | $243.96 | $847.0833333 |
| change | 50.6% | 50% | -8.8% |
With $33,450 in 2015 being worth $34,335.46 today.
| Ford Focus Electric Model/Year | EPA Range (Miles) | Battery Capacity (kWh) | MSRP Price (USD) | $/mile | $/kWh |
|---|---|---|---|---|---|
| 2015 | 76 | 23 | $29,995 | $395 | $1,304 |
| 2017 | 115 | 34 | $30,000 | $260.8695652 | $882.3529412 |
| change | 51.3% | 47.8% | 0.01% |
With $29,995 in 2015 being worth $30,789.00 today.
Tesla Model 3
At the time of writing, Bloomberg’s Model 3 tracker said that 145,538 units have been produced to date (since October 2017 when production really started), and is currently at 4,168 weekly units.
The Nissan Leaf has sold 370,000 units since 2010, around 37,000 each year. Production isn’t expected to ramp up much beyond this level.
September 2018 seen 23,582 Model 3’s sold Worldwide, compared to 9,623 Leaf sales. And October 2018 seen 18,852 Model 3 sales vs 8,307 Leaf sales.
Due to these facts, our prediction is that the Model 3 will become the best selling electric car by the end of 2020.
Finally, the August 2018 sales data was from CleanTechnica who themselves used data from GoodCarBadCar, InsideEVs, TroyTeslike and Kelly Blue Book.
Charging stations
European Union L1/L2 charging station data is from the European Alternative Fuels Observatory:
| Year | L1/L2 charging points |
|---|---|
| 2011 | 2392 |
| 2012 | 9196 |
| 2013 | 16756 |
| 2014 | 24916 |
| 2015 | 48156 |
| 2016 | 85656 |
| 2017 | 126607 |
| 2018 (extrapolated) | 166334.4 |
| 2018 (until October 2018) | 138612 |
And EU data for L3 (rapid DC) chargers is:
| Year | Rapid L3 charging points |
|---|---|
| 2011 | 0 |
| 2012 | 296 |
| 2013 | 1013 |
| 2014 | 2349 |
| 2015 | 6240 |
| 2016 | 12813 |
| 2017 | 16199 |
| 2018 (extrapolated) | 22681.2 |
| 2018 (until October 2018) | 18901 |
For current American data which does show L1/L2/L2 charging data, we can use AFDC:
| Type | Right now (towards end of Dec 2018) |
|---|---|
| L1 | 2046 |
| L2 | 45880 |
| L3/DC Fast | 9203 |
| total | 57129 |
For slightly historical data (going back 6 months, to analyse trends), a news article from Energy.gov is useful:
| Type | Mid Dec 2017 |
|---|---|
| L1 | 0 |
| L2 | 42618.54 |
| L3/DC Fast | 5267.46 |
This shows a big increase in L3/rapid DC chargers, but the Energy.gov news article just uses data from AFDC so there’s no reason why this wouldn’t be accurate – especially since we know that Tesla are constantly adding new Superchargers.
And for historical American charger data, albeit data which isn’t partitioned by the charger type, we can look at a Forbes article:
| Year | Total L1/L2/L3 |
|---|---|
| 2016 | 40075 |
| 2015 | 31003 |
| 2014 | 26077 |
Useful resources
Thanks for the following useful resources that helped make this infographic:
- Photopea – a great free (and web based) alternative to Photoshop
- Icons from IconsPNG and IconFinder: